This post summarises a coursework project from my MSc Research Methods module, completed at Wrexham University. It's a controlled comparison of three machine learning models on static malware detection. Code is on GitHub.
Background
Signature-based antivirus struggles to keep up with malware that mutates faster than signatures can be written. One alternative is static analysis: instead of running a suspicious file, you extract features from the Windows Portable Executable (PE) structure (header fields, imported functions, byte histograms, section statistics) and let a machine learning model classify it as benign or malicious. No execution, so it scales to millions of files safely.
The problem is that the research literature is hard to compare. Studies report impressive numbers on the same benchmark datasets, but they differ in preprocessing, sampling, feature scaling, train/test splits, and metrics. Two papers claiming "98% accuracy" might not be measuring the same thing at all.
So rather than chase a new state-of-the-art detector, this project asked a narrower, more honest question: under one locked pipeline (identical data, identical split, identical metrics), how do three different model families actually compare?
What I Tested
Three models, chosen to represent three distinct approaches:
- Linear SVM: a margin-based linear classifier (the interpretable baseline)
- LightGBM: a gradient boosted tree ensemble (the tabular-data workhorse)
- 3-layer MLP: a feedforward neural network in PyTorch (the deep learning comparator)
The whole point was to hold everything else constant so that any performance difference reflects the model, not the experimental setup.
The Dataset
I used EMBER 2018, a standard benchmark of static PE features published by Elastic. The full labelled corpus is 571,350 samples, almost perfectly balanced (49.9% benign, 50.1% malware). Each sample is a 696-dimensional numeric feature vector:
| Feature group | Count |
|---|---|
| Byte histogram | 256 |
| Byte entropy | 256 |
| String features | 104 |
| Data directories | 30 |
| Section info | 20 |
| PE headers | 17 |
| General file info | 10 |
| Imports / Exports | 3 |
| Total | 696 |
To keep training feasible on a CPU-only laptop, I drew two stratified random subsets (preserving the class balance):
- Run 1 (main): 50,000 samples, seed 42 → 35,000 train / 15,000 test
- Run 2 (robustness): 30,000 samples, seed 123 → to check the ranking wasn't a fluke of one split
Scaling was applied only where it matters. StandardScaler was fitted on the training set for the SVM and MLP (both are scale-sensitive), while LightGBM trained on raw unscaled features, since tree splits don't care about feature magnitude. The scaler was fitted on train and applied to test, never the other way around, to avoid data leakage.
The Models in Detail
Hyperparameters were selected via 3-fold cross-validation on the training set, then frozen before touching the test set:
- SVM:
LinearSVC, best C = 1 (CV F1 0.8159) - LightGBM:
n_estimators=300, learning_rate=0.1, max_depth=8(CV F1 0.9440) - MLP: 696 → 256 → 128 → 1, ReLU activations, dropout 0.4, Adam (lr 0.001), batch size 256, 7 epochs,
BCEWithLogitsLoss
Everything ran on an Intel Core i7-8650U (1.90 GHz) with 16 GB RAM, CPU only, no GPU.
Results
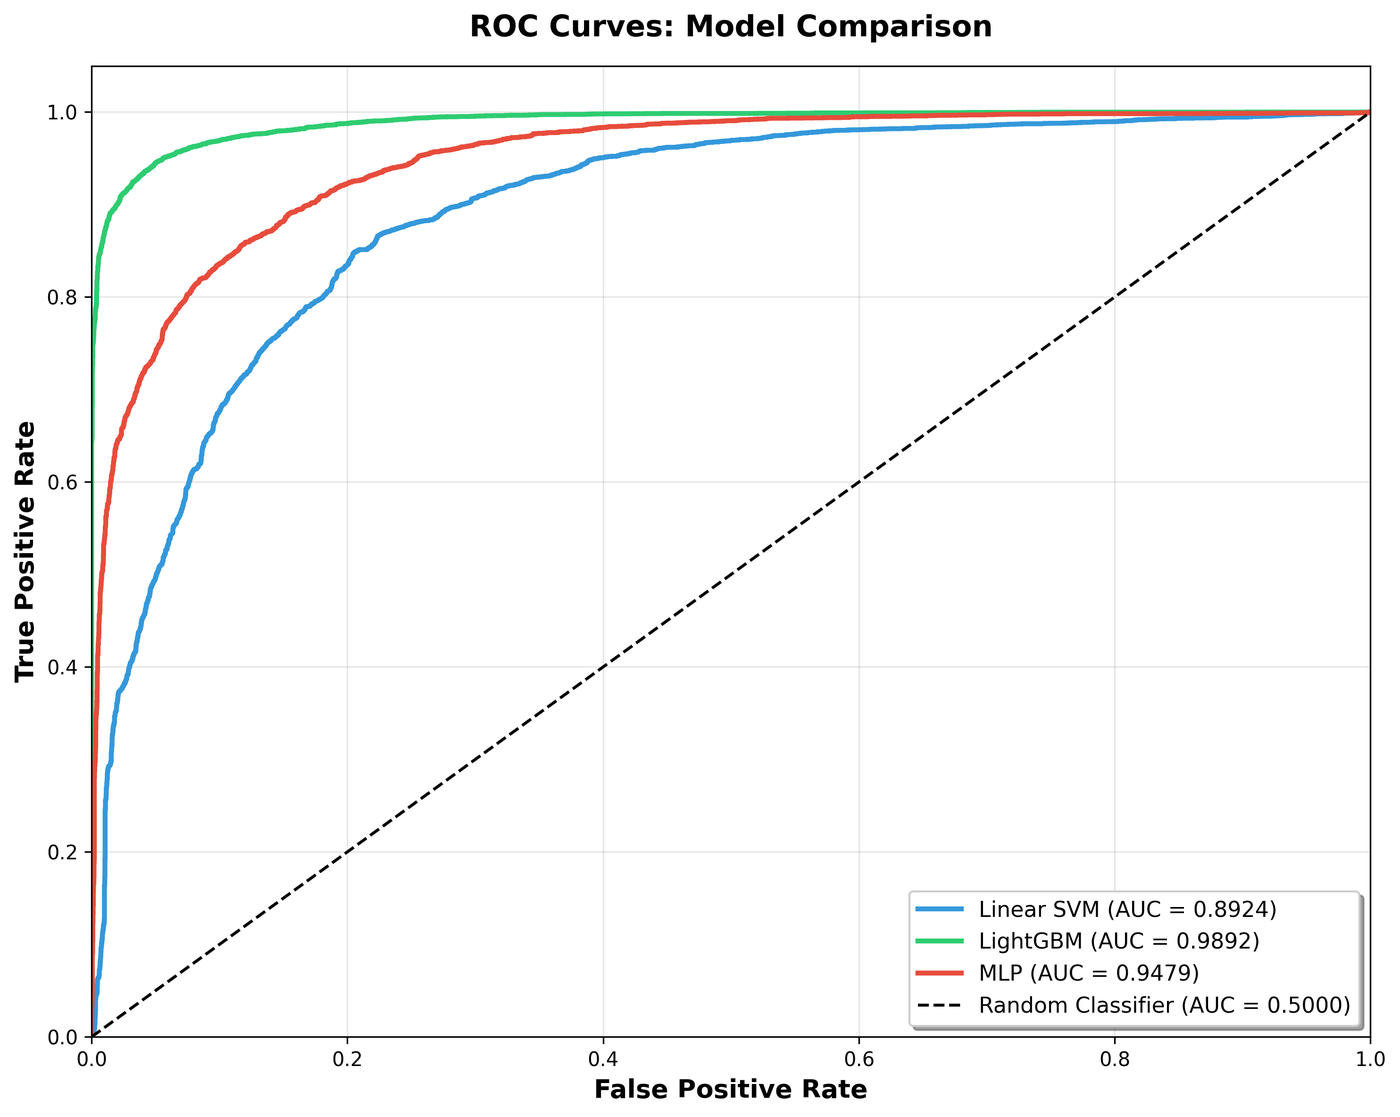
On the shared 15,000-sample test set (Run 1):
| Model | Accuracy | Precision | Recall | F1 | ROC AUC |
|---|---|---|---|---|---|
| Linear SVM | 0.8172 | 0.8108 | 0.8283 | 0.8194 | 0.8924 |
| LightGBM | 0.9474 | 0.9486 | 0.9462 | 0.9474 | 0.9892 |
| MLP | 0.8679 | 0.8885 | 0.8417 | 0.8645 | 0.9479 |
LightGBM won across every metric. The ordering was clear and consistent: LightGBM > MLP > linear SVM.
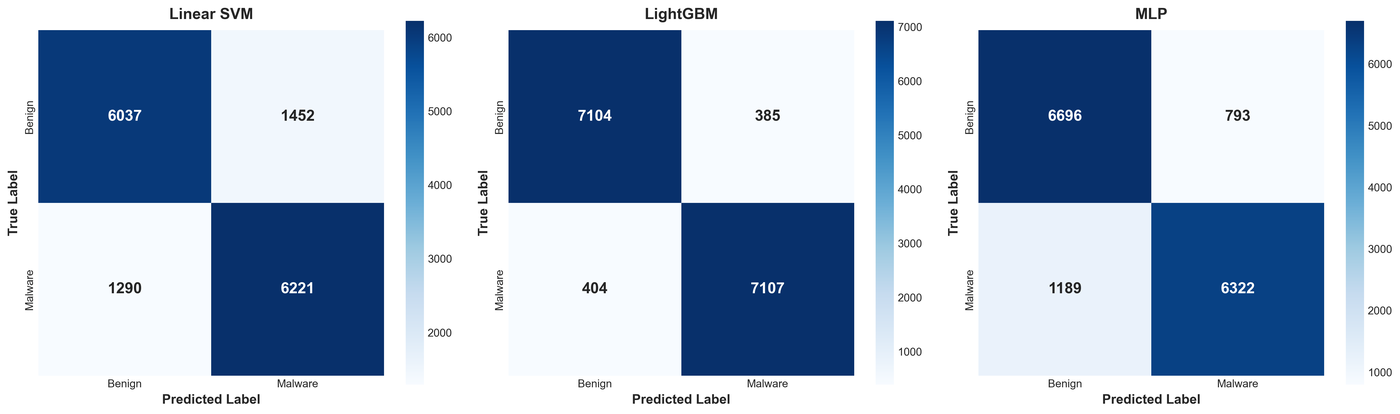
The error breakdown tells the operational story. False positives mean benign software gets quarantined (annoying, erodes trust); false negatives mean malware slips through (dangerous):
| Model | False Positives | False Negatives |
|---|---|---|
| LightGBM | 385 | 404 |
| MLP | 793 | 1,189 |
| Linear SVM | 1,452 | 1,290 |
LightGBM made roughly a quarter of the SVM's errors on both sides. The MLP sat in between but leaned toward missing malware (1,189 false negatives) more than raising false alarms, a worse failure mode in a detection context.
The Surprise: Cost Ran Backwards
My second hypothesis predicted the MLP would be the expensive option. That's the usual story about deep learning: more accurate, but heavier to train. The data said the opposite.
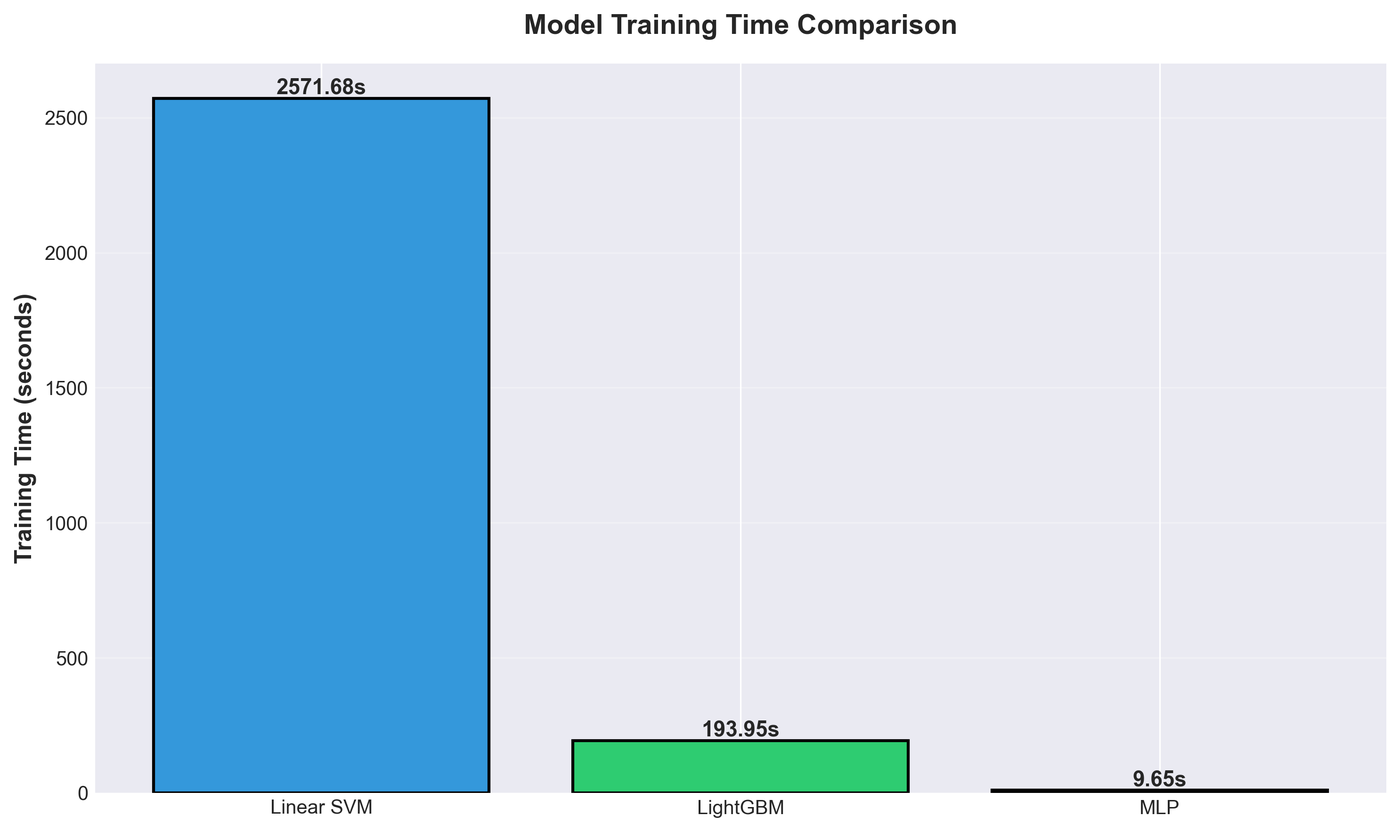
| Model | Training time |
|---|---|
| MLP | 9.65 s |
| LightGBM | 193.95 s |
| Linear SVM | 2,571.68 s |
The "simple" linear SVM took 43 minutes. The neural network finished in under 10 seconds, roughly 266× faster than the SVM and 20× faster than LightGBM.
Why? LinearSVC solving a margin optimisation over 35,000 samples in 696 dimensions is genuinely expensive, and it threw convergence warnings under the default iteration budget. The MLP, by contrast, only does 7 quick passes of mini-batch gradient descent, cheap per epoch, and it converges fast on this kind of structured tabular data. The lesson stuck with me: "simple model = cheap" is an assumption worth measuring, not believing. My hypothesis was right about the MLP's accuracy being mid-tier, but completely wrong about its cost.
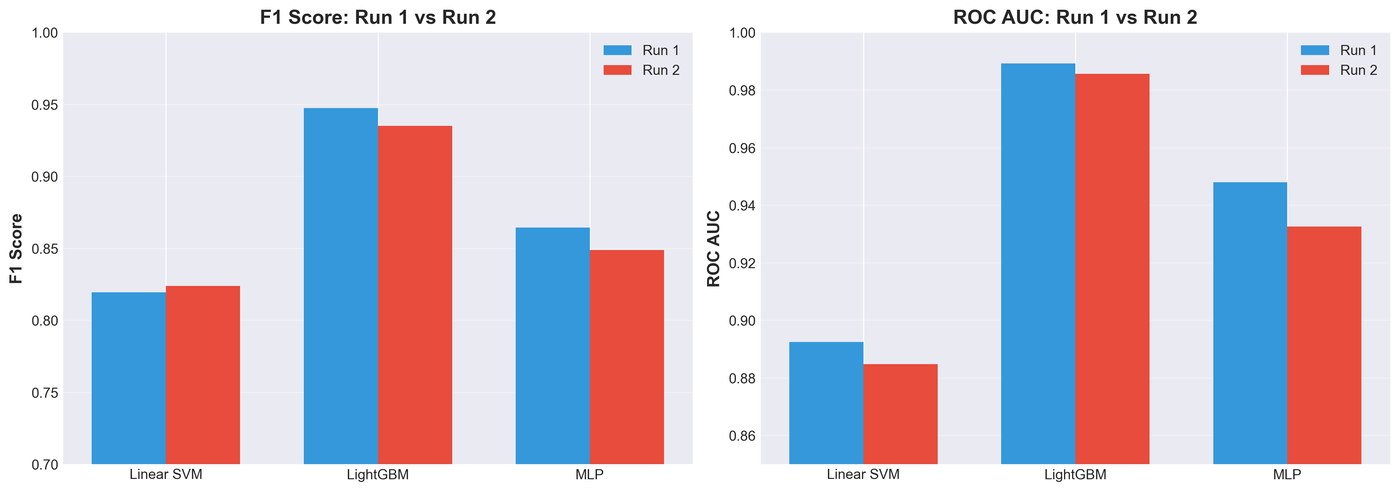
Robustness Check
A single train/test split can mislead. So I reran the entire pipeline on Run 2 (a different 30,000-sample subset with a different seed) to see whether the ranking held:
| Model | Run 1 F1 | Run 2 F1 | ΔF1 |
|---|---|---|---|
| Linear SVM | 0.8194 | 0.8237 | 0.0043 |
| LightGBM | 0.9474 | 0.9350 | 0.0124 |
| MLP | 0.8645 | 0.8487 | 0.0158 |
Every model moved by less than 2% F1, and the ordering (LightGBM > MLP > SVM) was identical. The comparison isn't an artefact of one lucky split.
What This Means in Practice
For CPU-bound static screening, boosted trees are the pragmatic default. LightGBM gave the best accuracy, the most balanced error profile, and trained comfortably on a laptop. It also supports feature attribution (e.g. SHAP), so its decisions can be explained, which matters when a security analyst has to justify why a file was flagged.
Don't assume deep learning is the costly choice. On structured features like these, a small MLP was the cheapest model to train by a wide margin. If you need fast retraining cycles, it's attractive, but watch the false negatives, which were its weak point here.
The linear SVM was the worst of both worlds on this problem: lowest accuracy and longest training time, with convergence issues that would make frequent retraining painful at this dimensionality.
Limitations
A few honest caveats:
This is a comparison within the EMBER 2018 static-feature snapshot, not a guarantee of real-world performance. The evaluation used random splits, not time-based ones, so it doesn't capture concept drift. Malware evolves, and a model trained on 2018 data will degrade against newer samples.
Static features are also vulnerable to packing and obfuscation, which deliberately distort the feature distribution to evade detection. That's a known weakness of this whole approach.
I used a reduced 696-feature representation and capped subsets for CPU feasibility, so absolute numbers might shift with the full dataset, but the relative comparison, which was the point, holds.
Takeaway
Under a controlled, reproducible pipeline, LightGBM was the clear winner for static PE malware detection: best accuracy, fewest errors, explainable. But the result I remember most is the one that contradicted my own hypothesis: the deep learning model wasn't the expensive one. It pays to measure your assumptions rather than inherit them from conventional wisdom, the same lesson, as it happens, that ran through my WAF dissertation work.